
Google Analytics is a product of Google which is free for business website owners where you can analyze your website traffic, website behavior, traffic source, traffic location (city, country), leads report etc. Google analytics setup is different for both websites – eCommerce and simple. You can learn it from Google Analytics Help and you can setup your business website easily. I am providing here some important Google analytics functions and features here.
Google Analytics Setup
- Step 1. Login Google Analytic account with your Gmail ID
- Step 2. Fill up the Google analytics form carefully.
- Step 3. Copy tracking code and put it into website’s head section.
Wait for 1-2 days. Now you can see your website’s data.
Google Analytics Overview
There are 8 Google analytic functions in the image, all have own value or functionality.
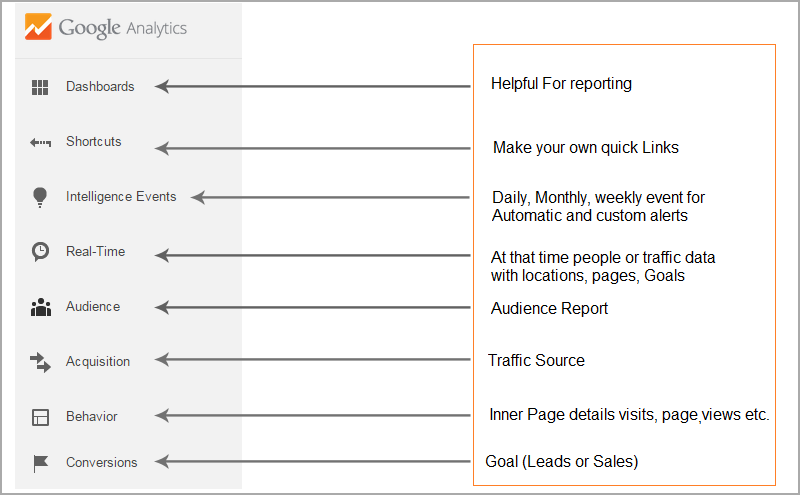
Dashboard – You can set your customize report
Shortcuts – Where you can add essential pages of Google analytics for fast access. (Quick links)
Intelligence events – Here you can add daily, weekly and monthly events. (Automatic & Custom)
Real Time – You can check your website traffic location, source and conversations at that moment. It only provides real time data and updates in every second.
Audience – Here you can check your audience
- You can check website traffic with Location (city, state & Country)
- You can check your website traffic on the basis of devices (Mobile, Desktop, Tablet)
- You can also check gender, language, browser, bounce rate, Benchmark combination
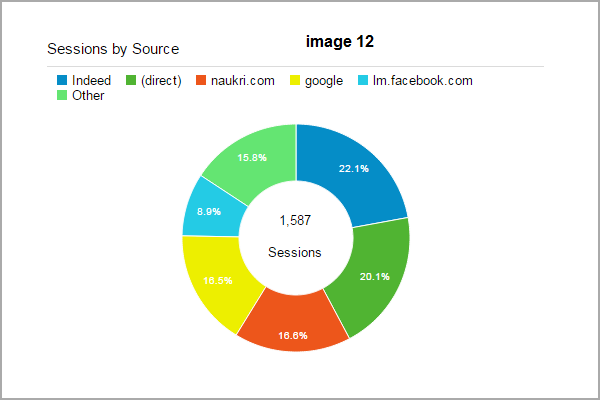
Acquisition – Here you can check your website traffic and traffic sources detail on the basis of direct, paid, organic, referral, social (channels)
Behavior – Here you can check visits from landing pages and exit pages with page views.
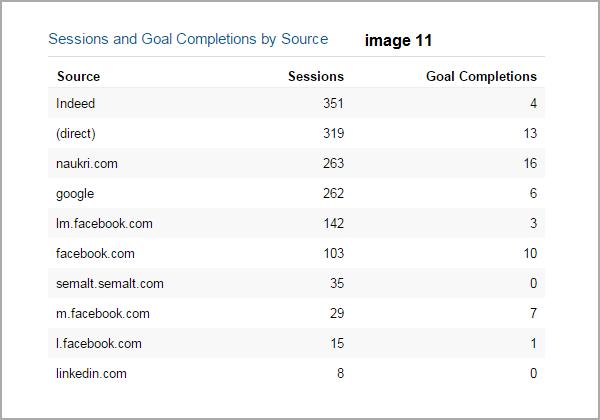
Conversations – Here you can check how much goals (leads) you achieve.
All functions or features are helpful to analyze your business website and you can optimize your business growth easily but there is a simple solution where you can set all data in one page. CgColors is providing here a reporting technique which is very helpful, easy to understand and time consuming.
Google Analytics Custom Dashboard Report
You can create your own customize report from two sections which are given in image… (First is Dashboard and second is customization).
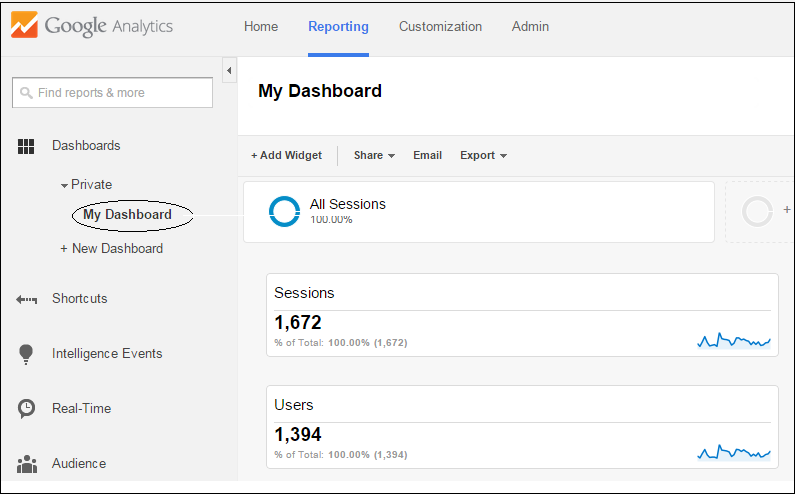
“My Dashboard” is the best option for reporting where you can add minimum 12 functions.
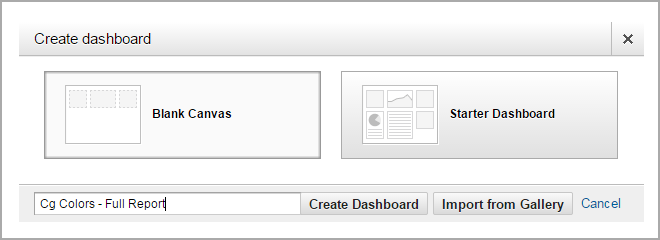
Step 1. Click on New Dashboard and choose your custom name like “Company Name – Full Report”
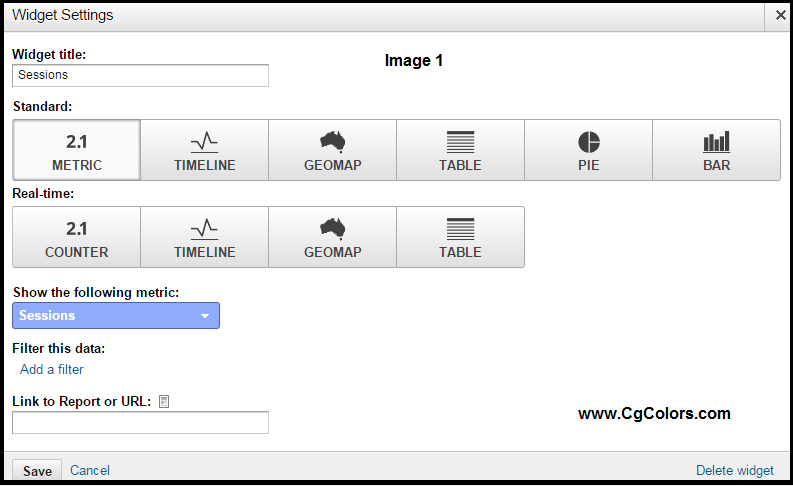
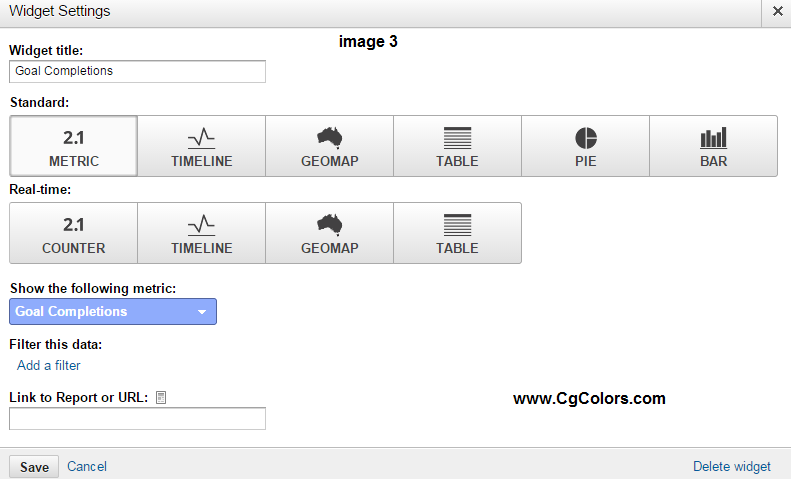
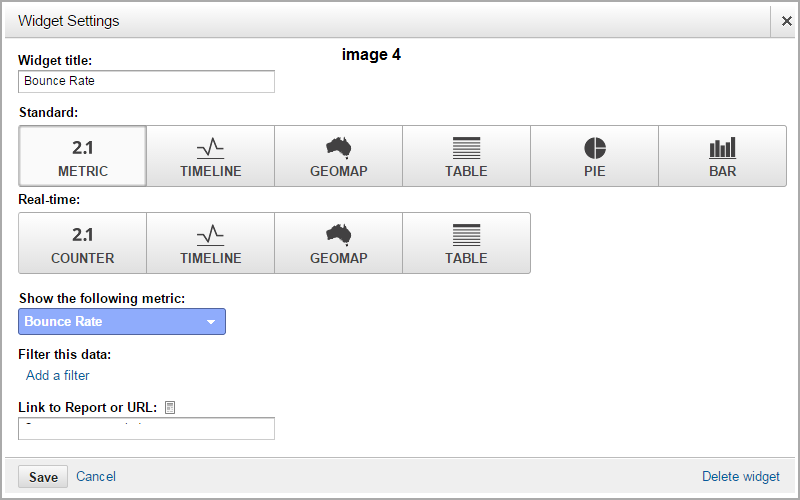
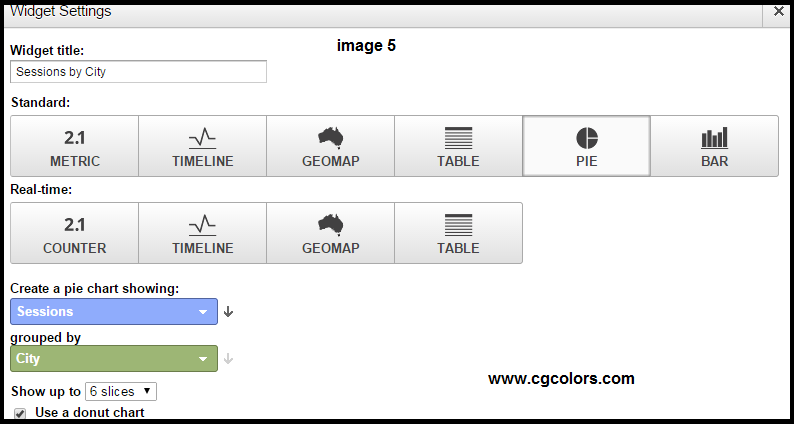
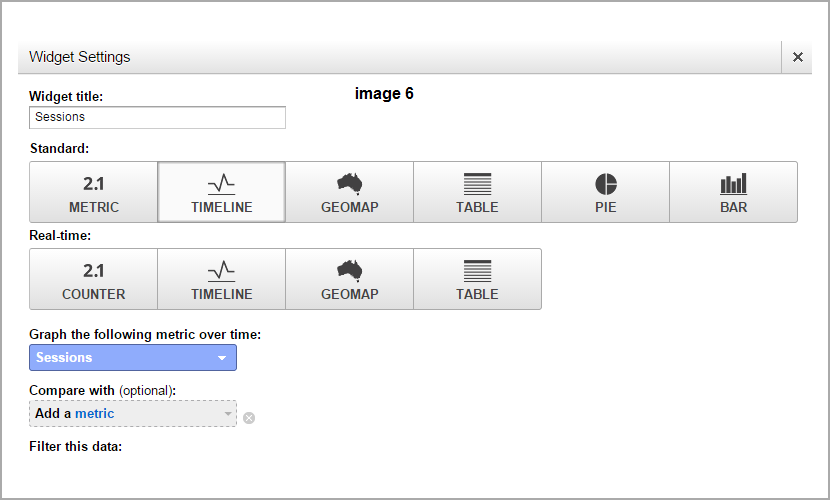
Step 2. Follow all 12 images
Dashboard Report-1.

Result of Report-1

Dashboard Report-2
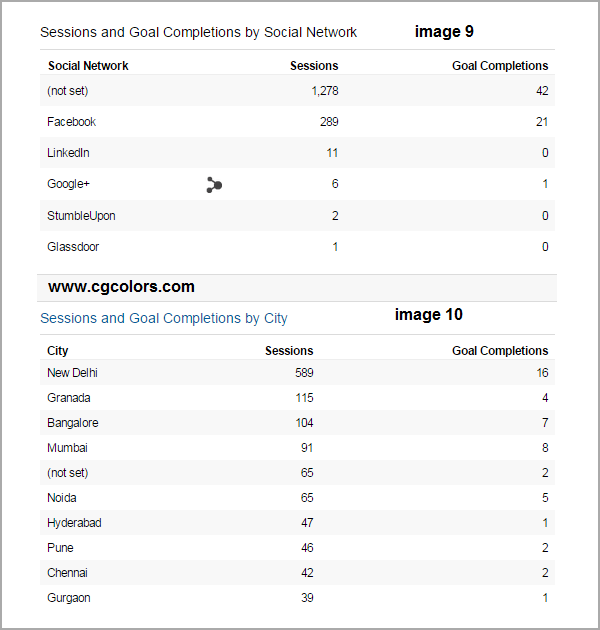
Result of Report-2
Dashboard Report-3
Result of Report-3

Dashboard Report-4
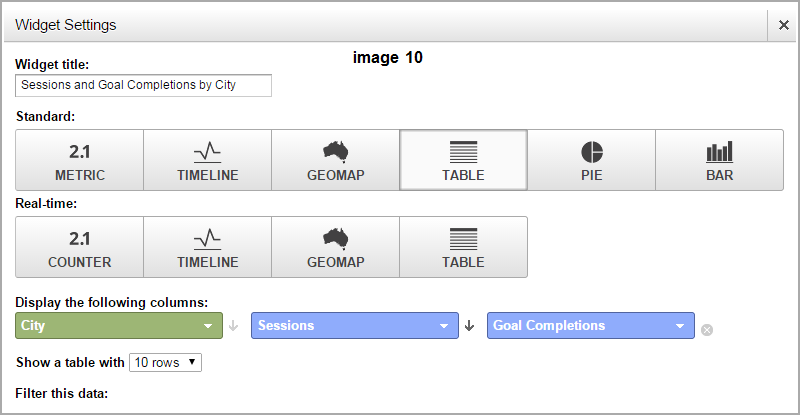
Result of Report-4
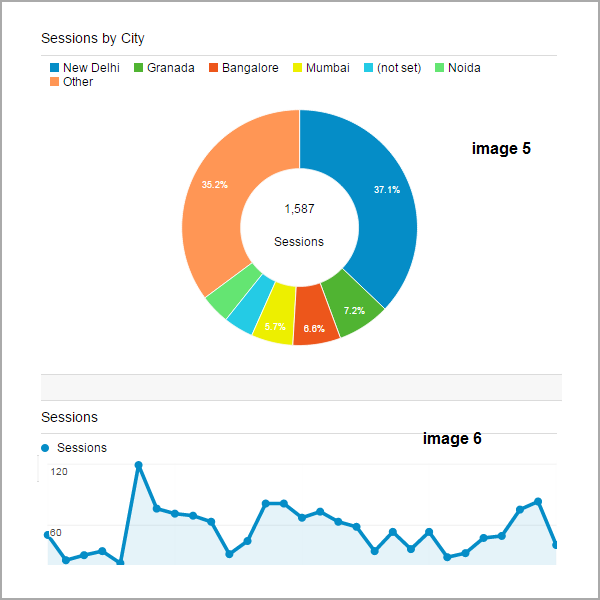
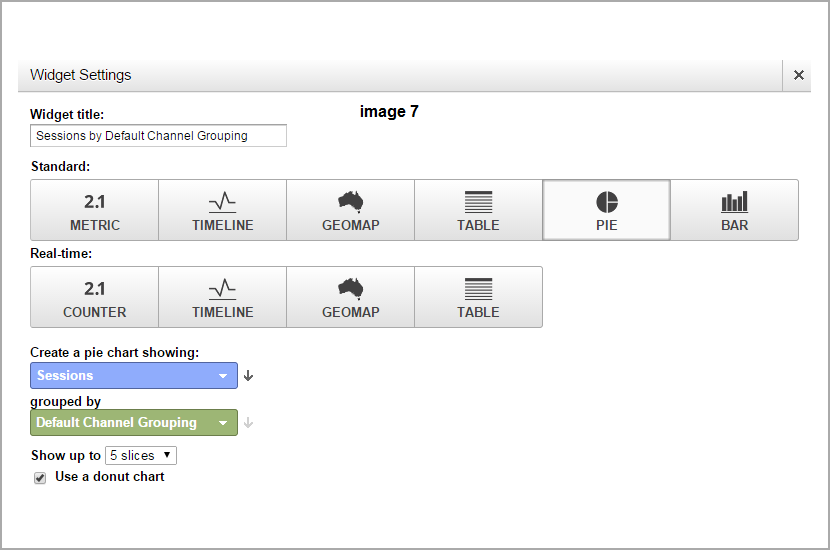
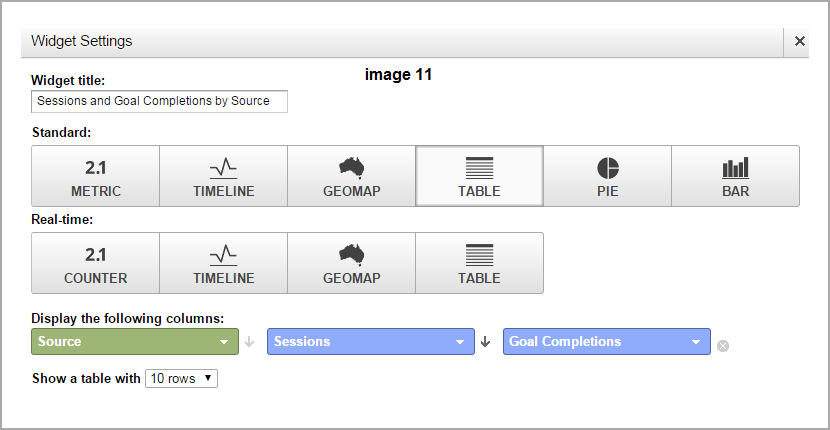
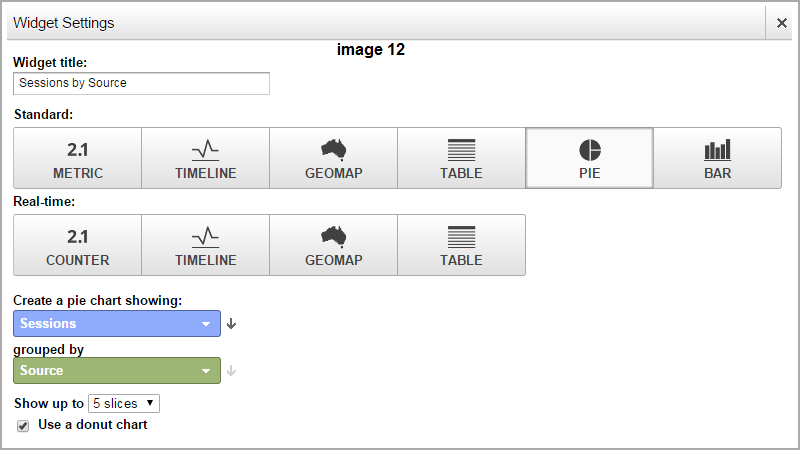
Dashboard Report 5
Result of Report-5
Note: Image 1 has his result in image 1 and image 2 has his result in image 2 and so on….
This is a perfect Google analytics customize report where you can check almost all type of data of your website. Here you can easily check your results in images.
Many popular SEO Companies don’t know how to prepare customize report. So this report is also helpful for those SEO agencies and companies also, you can impress your clients. Some technical words are there in this report like sessions mean visits. You can specify it in his client’s report.
New Features in Google Analytics which are recently added
1. Benchmarking – where you can see increment % and decrement % on the basis of channels (organic, paid, direct etc.), location (country) and devices (mobile, tablet, desktop).
2. In-Page Analytics – Where you can see which links on your website have how much clicks.
3. IP Filter – You can also cut your own IP data using IP Filter. Go to admin and setup the filter using your IP name.
CgColors is a Internet Marketing Company in New York etc.) and provides SEO, PPC, Digital Marketing, Social Media marketing, web design, mobile app development services.
If you are unable to setup your website Google analytics or you need help regarding Google Analytics than you feel free to contact us, we are here for 24 hours.
Consult with our SEO experts in New York today to get in detail about all Google Analytics major areas.